

DC’s Progress on the 2024 Nation’s Report Card
The 2024 National Assessment of Educational Progress (NAEP) results were released last week, providing an overview of academic performance in every state, the District of Columbia, and many large cities across America. Often referred to as the Nation's Report Card, NAEP assesses student proficiency in math and reading in grades 4 and 8 every other year. This year's findings paint a concerning picture of post-pandemic academic recovery in the United States and remarkably consistent progress in DC when compared to the nation. The District’s data also demonstrates the need for a strong commitment to bolder academic acceleration, especially for lower-performing students. Interact with the NAEP results using our DC-focused data dashboard.
National Summary
Fourth and eighth graders showed declines in reading performance compared to both pre-pandemic scores in 2019 and the last administration in 2022. While math scores remained flat for eighth graders and showed slight improvements for fourth graders, these gains were primarily driven by high-performing students, highlighting growing achievement gaps. A record 33% of eighth graders scored below NAEP's "Basic" threshold in reading, the highest percentage in the exam's history. The only notable bright spots were in fourth-grade math, where fifteen states (mostly in the Northeast and South) showed improvement since 2022, and Louisiana, which was the only state to show statistically significantly higher fourth grade reading scores compared to 2019.
DC’s Remarkably Consistent Improvement
The District’s overall average scores, in 4th and 8th grade math and reading combined, have never been closer to the national average than in 2024. The average DC student in 2007 scored 26 points below the national average, and by 2024, that gap shrank to 8 points. If current rates of improvement continue, our city is on track to post a higher average score than the average for large cities in 2026 and the nation in 2028. Compared to similar jurisdictions, demographically and geographically, DC posted the highest gains from 2022 to 2024.
2024 NAEP Scale Score Averages for All Tested Students

See breakouts of these charts by individual subject and grade further below.
Given the city’s changing demographics and EK12’s mission in supporting schools to drive equitable outcomes for economically disadvantaged students of color, we would normally start by focusing on results for students from low-income families. However, both NAEP and DC made a shift in how economically disadvantaged students are captured in the data, making longitudinal analyses of their performance challenging. More on that further below.
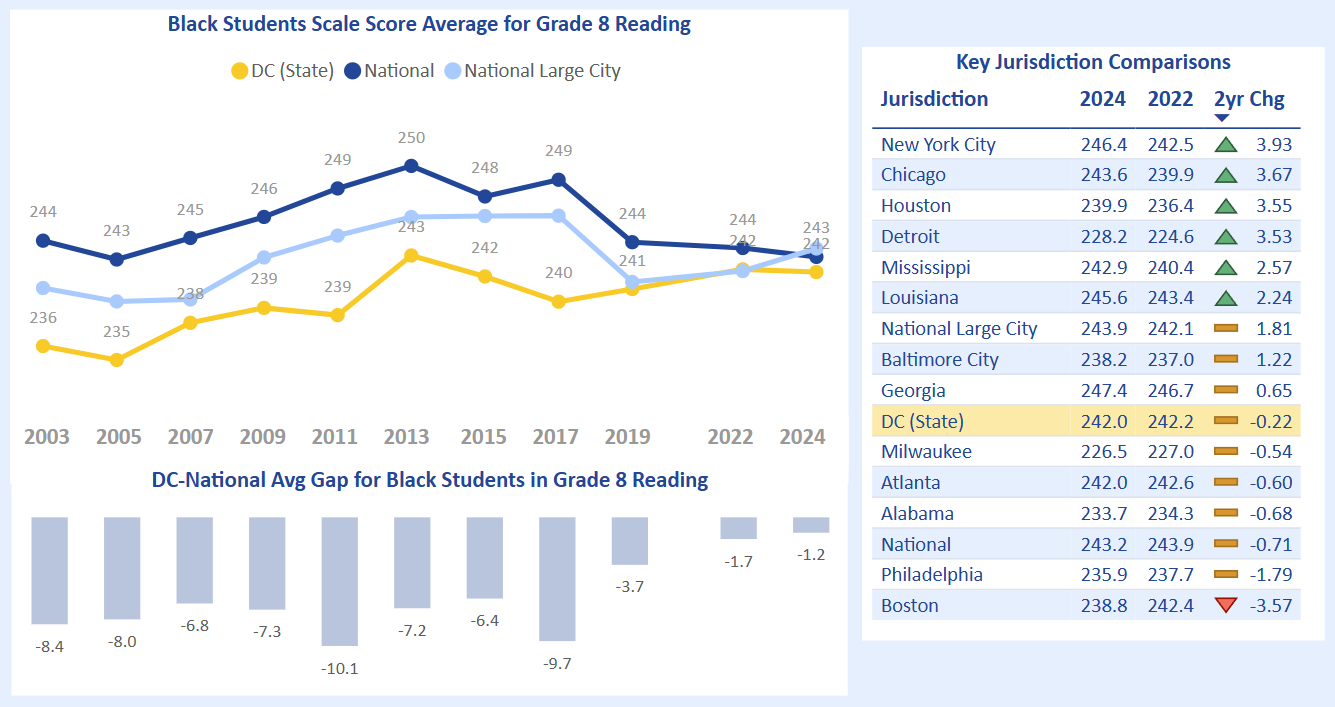
Instead, this year, we focus first on the performance of Black students in the District. The storyline for this historically underserved student population is similar to the citywide results, showing continued progress closing the overall gap with national averages. However, the rate of progress was slower than Black students in similar jurisdictions.
2024 NAEP Scale Score Averages for Black Students

While we are unable to report on the longitudinal progress of DC’s “economically disadvantaged” students this year, there is another variable in the NAEP data that may shed light on their progress, the highest level of education completed by students’ parents. Eighth grade students are asked each administration what was the highest level of education completed by their parents. Six percent of our students report that their parents did not complete high school and 18 percent said their parents completed high school and did not pursue post-secondary education. Nationally and in large cities, these students’ scores declined for the third straight NAEP administration. In the District, these students posted mixed results that were better than national averages.
2024 NAEP Averages for Students Whose Mother did not Complete High School

2024 NAEP Averages for Students Whose Mother Completed HS not Postsecondary

Details about Economically Disadvantaged Reporting
For the 2024 administration, both NAEP and DC changed the way economically disadvantaged was captured in the data. NAEP stopped reporting National School Lunch Program data (i.e. based on students’ status for receiving free or reduced-price meals) because of the prevalence of Community Eligibility provisions that provide all students with free meals at schools in lower income neighborhoods regardless of a student’s economic status. Another variable NAEP has historically reported is “economically disadvantaged,” a yes/no indicator reported to NAEP by states. This variable is reported by states, and each state gets to determine the business rules for student inclusion. Between the 2022 and 2024 NAEP administrations, DC shifted how it shared yes/no for economically disadvantaged from students who qualify for free or reduced-price meals to the at-risk definition (i.e. students whose family receives SNAP or TANF benefits or is in the foster care system).
Thank you to Kelley Scholl and the OSSE team for answering our questions and providing us with the chart below that shows the changes in how DC reports economically disadvantaged status to NAEP.

Due to the variance in states’ low-income definitions, NAEP created a new SES Index based on student answers to survey questions like “how many books are in their home” and “what is the highest level of education their parents have completed” to categorize students as Low SES, Average SES, and High SES. These cuts of the performance data are currently only available for 2024 results. However, NAEP expects to republish results for prior years based on the index sometime in the future.
Differential Improvement Rates for High and Low Performers
DC’s lower performing students at the 25th percentile continued to close the gap with other lower performing students nationwide and in large cities. However, their pace of improvement, a +1.4 average scale score point improvement, did not match the rate of improvement for DC’s higher performing students, +5.7 average scale score points. Nationally, lower performing students continued to fall further behind, posting consecutive losses every administration since 2013. It is a positive that DC’s lower performing students are making gains compared with their counterparts nationwide, but the gap between them and their higher performing peers has widened and will require doubling down on practices and interventions that support their growth.

Nationally, the scale score gap between higher and lower performance students, the difference in scores at the 25th and 75th percentiles, grew faster between 2022 and 2024 than it did during the pandemic from 2019 to 2022. Locally, gaps between DC students at the high and lower performance levels also grew at similar rates.

Teacher Absenteeism as Reported in NAEP Surveys
In addition to administering math and reading assessments to students, NAEP also surveys students, teachers, and school leaders. We noticed an interesting finding related to teacher absenteeism while perusing the survey results. Nearly 1 in 3 DC fourth grade students attend a school where more than 5% of teachers are absent on an average day, which is substantially higher than the national and large city averages of 12%. This is concerning given the negative correlation between student performance and teacher absenteeism rates in math. DC students’ progress could likely be even better if the sector can identify solutions that improve teacher attendance.

Additional Charts by Grade and Subject
The charts below breakdown summary overall charts provided above into the four tested grade-subject combinations.
Grade-Subject Charts for All Tested Students


Grade-Subject Charts for Black Students


Grade-Subject Charts for Lower Performing Students at the 25th Percentile


