
COVID-19’s Impact on Student Well-Being in DC
While the COVID-19 pandemic has taken a toll on student academic growth since abruptly ending in-person school in March, negative impacts on student well-being has been assumed, but less well understood.
This fall, EmpowerK12, in partnership with seven DC charter school networks and local school-based mental health experts, set out to learn how DC students feel about and experience life and school. This blog post summarizes key findings from the fall survey and shares promising practices implemented at participating schools as a result of the data.
Early reports on college student well-being (from New Jersey and Boston University) found many students were experiencing increased academic and everyday difficulties and high levels of mental health distress. High levels of depression were associated with difficulties in focusing on academic work. For K–12 students, the national nonprofit, YouthTruth, surveyed 5th-12th graders, finding the most frequently cited obstacles to virtual learning were distractions at home (64 percent) and feeling depressed, stressed, or anxious (50 percent). On average, Black and Latinx students faced more obstacles than White and Asian students.
About the DC Survey
The fall DC Student Well-Being Survey is the first student well-being survey designed by local mental health professionals, administered by multiple school networks, and analyzed with cross-network collaboration. Experts from four of the participating school networks, the GWU Center for Health and Health Care in Schools (CHHCS), and EmpowerK12 co-created the survey utilizing open-source well-being surveys along with local expert input. Survey questions ask students about hardships they face during the pandemic, their relationships inside and outside of school, and their perspectives on distance learning.

Participating students’ demographic information.
Over the course of four weeks starting in late September, nearly 2,500 students in grades 3-12 from 22 DC charter schools anonymously completed the survey.
Each charter school network received a dashboard tracking participation and survey results data. School leaders also received a dashboard comparing their students’ responses to those at “similar schools” with participating schools’ results weighted by a similarity index score based on student demographics, age, ward of residence, and percent of students with food always available and permanent homes for better school-level comparisons.
School leaders and CHHCS mental health professionals (who help facilitate the DC Department of Behavioral Health's school-based mental health Community of Practice which DCPS, charters, and OSSE all attend) analyzed survey results and shared how they utilized their own data to supports for students after the administration window closed.
Summary of Key Findings
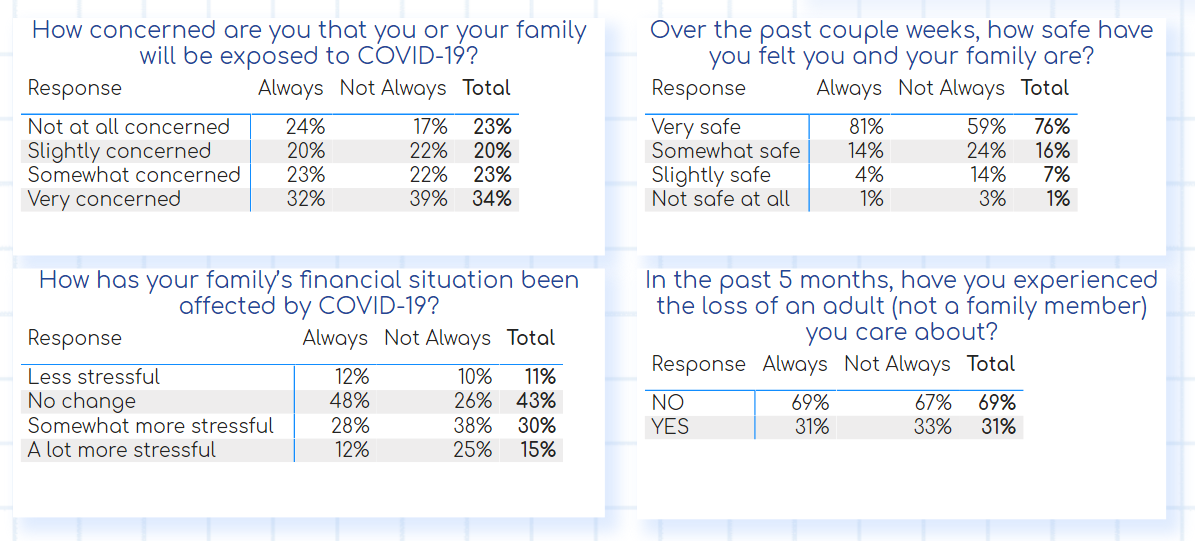
In the DC Student Well-Being Survey, students reported anxiety related to the pandemic (77 percent are concerned that their family will be exposed to COVID-19) and nearly half (45 percent) report that their family’s financial situation has become somewhat or significantly more stressful due to the pandemic. Nearly one in five students recently experienced the loss of a family member they live with. In the literature, students are similarly impacted emotionally when they lose a family member regardless of whether the loss is a result of death, divorce, or moving away, so that is why the question is framed as asking about “loss” more generally. Two-thirds of students have been unable to participate in an activity that they normally do and makes them happy.
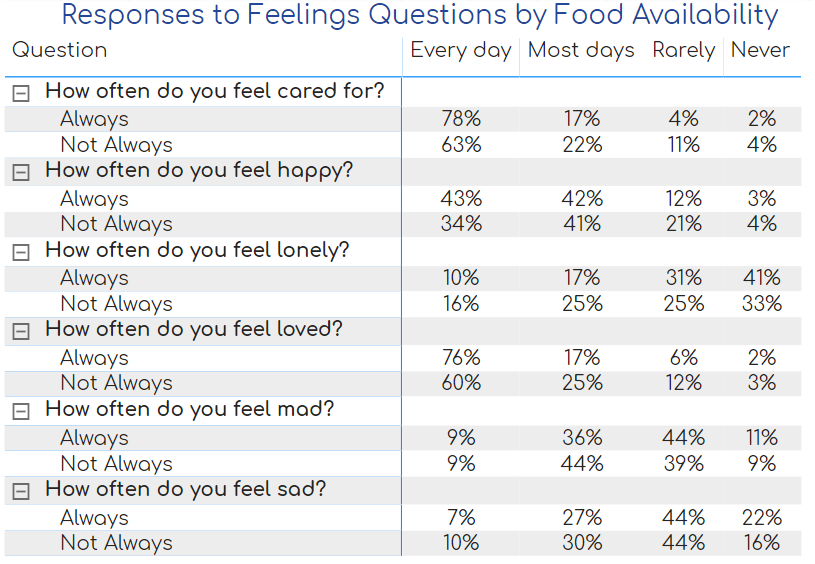
Responses to two hardship questions (“Is there always enough food available for you and your family?” and, “Do you have a permanent home or apartment?”) were highly correlated with responses to several of the trust and feelings questions (such as “How often do you feel happy?”) and distance-learning success questions (such as “How sure are you that you will perform well in school while distance learning?”). Students in unstable housing situations and who sometimes experience food scarcity were more likely to negatively respond to well-being questions about themselves and school life.
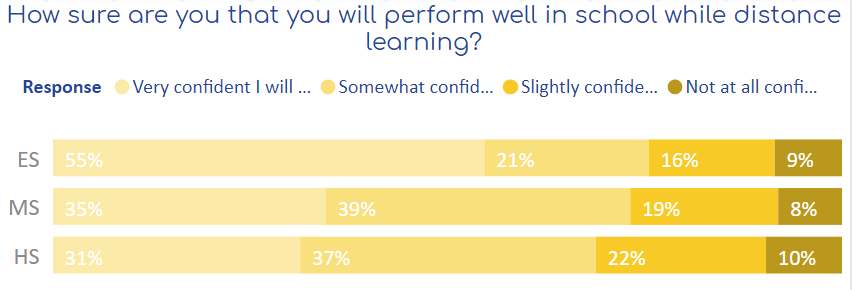
Elementary school students were more likely to report confidence in their success this year (55 percent are very confident) and appear to be less social-emotionally impacted by the pandemic.
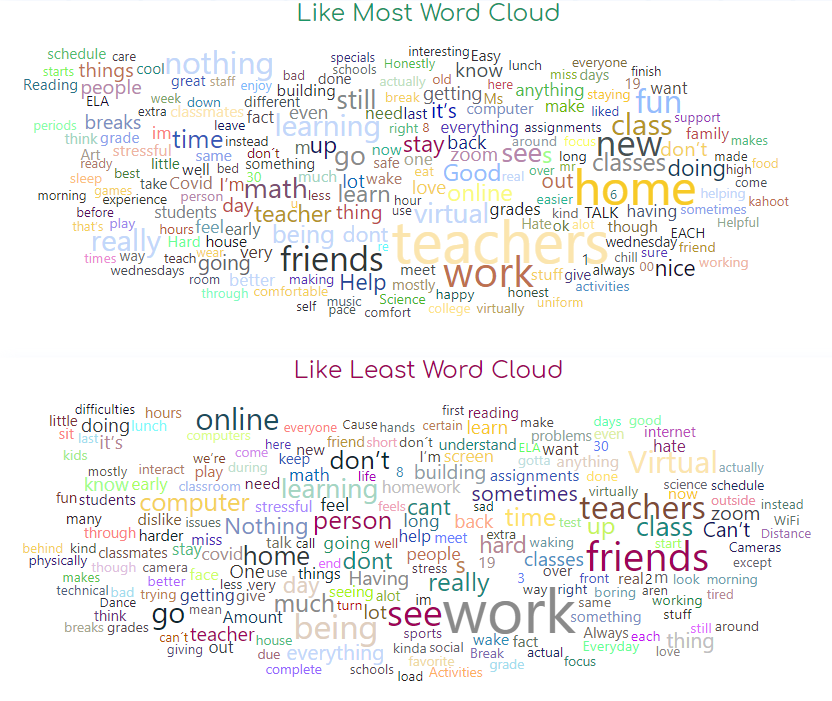
Meanwhile, high school students are statistically significantly less likely to be confident in their success this year (only 31 percent are very confident) and more likely to express negative emotions about life and school. One of the most common responses by high schoolers to the open-ended question, “What do you like most about school so far this year?” was the word, “nothing.”
Middle school student responses to trust, feelings, and distance learning questions tended to fall in-between elementary school and high school students’ response rates but closer to high schoolers. For example, 35 percent of middle schoolers are very confident they will perform well in school while distance learning.
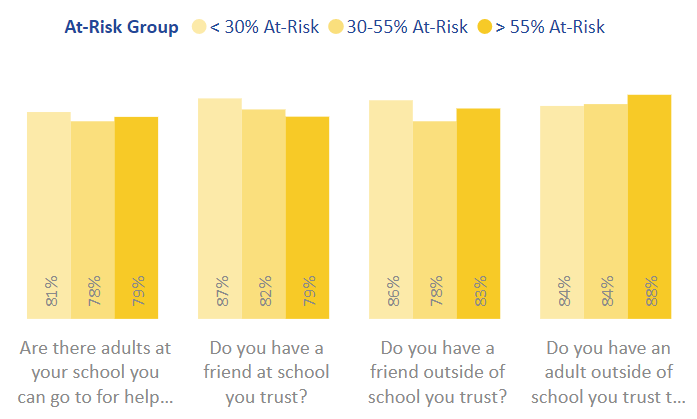
Students who attend schools that serve a majority at-risk student population were less likely to report that they have a friend at school and that they feel loved. On the positive side for schools, there were no differences across student and school demographics to the question, “Are there adults at school you can go to for help if you need it right now?” Across all schools, four-fifths of students answered that there was at least one adult at school they could go to for help right now (81 percent at low at-risk schools and 79 percent at high at-risk schools).
How Participating Schools are Responding to the Data
Results are helping inform “tier one” school and LEA-level interventions at participating charter school networks and guide school-based mental health support programming across the city. Here are four ways in which participating schools are translating the data into action.
Friendship Public Charter Schools
Friendship Public Charter Schools, a network with nine campuses across DC, is providing additional food to families who need it the most. Staff noticed many students were reporting that they only sometimes or never had enough food available. Since the survey was anonymous, schools reached out directly to families to see if they needed food and began providing those who needed help with extra grocery supplies beyond weekday breakfast and lunch.
Thurgood Marshall Academy
Thurgood Marshall Academy, a Ward 8 high school, presented aggregate school-level Well-Being Survey data to their students and facilitated exploratory conversations to gain deeper insight into student responses. The goal of the student-led conversations was to identify what programmatic interventions students thought would be most helpful to their peers. Staff also asked students why they thought some students were more comfortable learning from home than in-person to illuminate what adjustments may be necessary to the school day once in-person learning is possible.
Center City Brightwood
Center City Brightwood, a Pre-K-8 school in Ward 4’s Brightwood neighborhood, is tracking student mental health on a weekly basis via a student survey. Initially, students completed a survey at the end of their asynchronous Wednesday sessions, and now students enter data through an optional link via weekly update e-mails on Tuesday. The survey asks students how they are feeling, how they are doing with distance learning work, what fun things they plan to do, and which teachers they want to check-in with one-on-one. The weekly touch point helps teachers closely monitor student progress and ensure students who need additional support receive it. The school continues to cultivate student and teacher relationships through its use of weekly student reflection circles that include students across multiple grade levels.
Inspired Teaching Demonstration School
Inspired Teaching Demonstration School, a Pre-K-8 school in Ward 5’s Edgewood neighborhood, organized focus groups of parents and teachers to review their school’s Well-Being Survey data by grade level. The focus groups probed the challenges students and families are experiencing and generated change ideas to improve well-being for all student groups.
What’s Next and What Can Our Community Do
EmpowerK12 plans to support the facilitation of a winter and spring survey to continue tracking student well-being as the pandemic continues and (hopefully) subsides, and the challenging task of recovery begins. New schools wishing to participate in the winter and spring administrations should contact their EmpowerK12 partner support person.
Tracking improvement of student well-being is essential to recovering the academic slide that likely occurred this spring due to the pandemic. Volumes of research into the impacts of trauma and adversity on the brain demonstrate the devastating toll they can take on learning (Turnaround for Children is a good research resource on this topic). There is lots of hard work ahead repairing student relationships with adults and peers when school can return in-person. We likely need to double-down on the recent Mayoral and City Council investments in school-based mental health and the use of trauma-informed practice in our classrooms. CHHCS has a good brief on the social influencers of education and the roles state and local school leaders can play in addressing them.
Utilizing common student and family well-being surveys can help our schools and community-based organizations track down bright spots where student well-being is improving faster to learn from and spread their promising practices. In the meantime, the Wallace Foundation and Collaborative for Academic, Social, and Emotional Learning (CASEL) have compiled guides on social-emotional learning programs with positive results for schools looking to infuse additional SEL lessons into their hybrid learning regimen.
Appendix: Additional Survey Response Data Figures
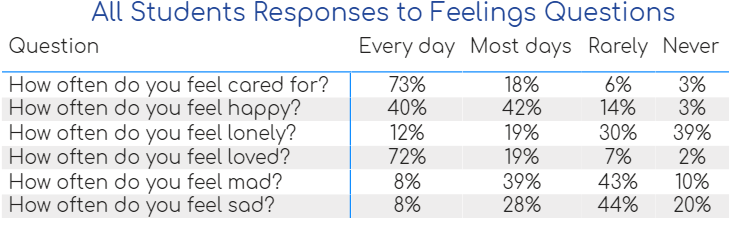
How all survey respondents answered feelings questions:
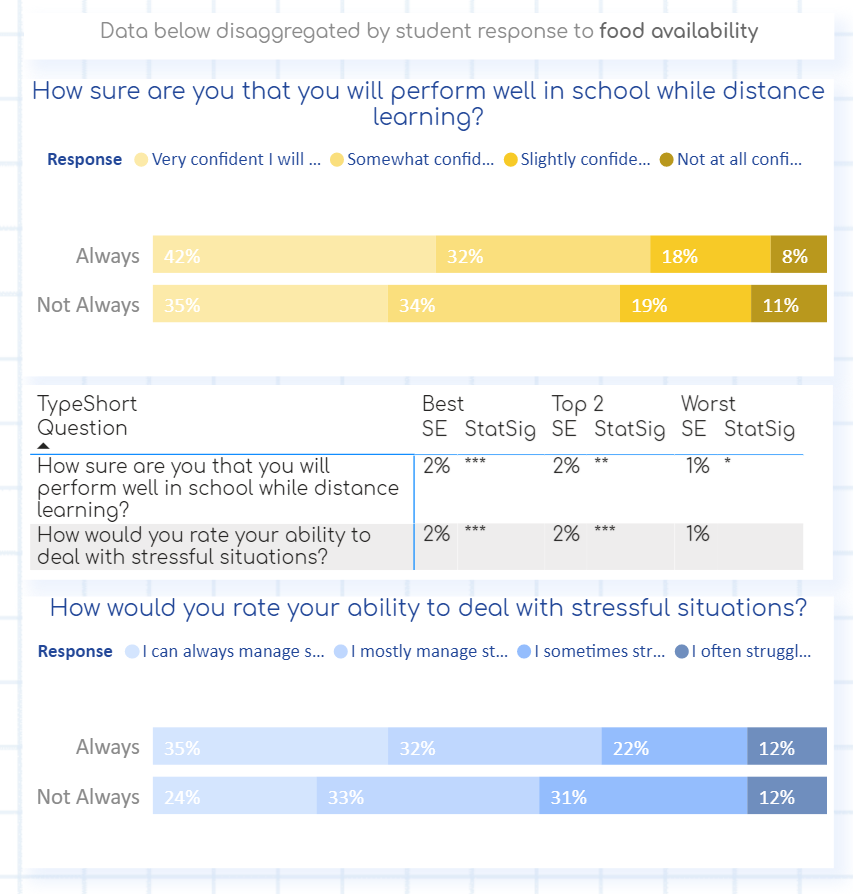
Differences in response rates to key distance learning questions by whether students have enough food always available to them:
Pandemic-related questions with responses disaggregated by food availability:
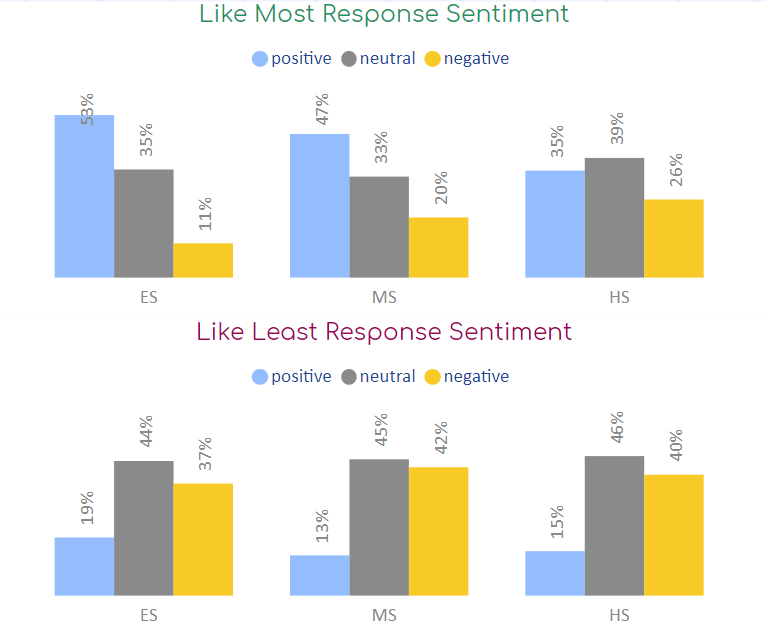
We asked students what they liked most and least about the school year so far, analyzing the data for common words and sentiment. These charts show the percent of students responding to those questions with something positive, neutral, or negative. You can see high school students were much less likely to write something positive to the question about what they like most about school.
These word cloud visualizations show the most common words used to answer the open-response questions, the larger the word the more often it was used. For words like "friends" and "teachers," students often paired them in phrases like "don't see my friends and teachers" when answering the question about what they like least and phrases like "seeing my new friends and teachers on zoom" when responding to what they like most.