

Influence of Demographic Factors on STAR Scores by Framework
Obligatory warning: This blog post is written for the eduData wonk audience. We examine in-depth the relationship between demographic factors and STAR scores. The post is super heavy on statistics and data science.
Significant literature directly links socioeconomic and other student characteristics to many important school-based outcomes, including student achievement, growth, and mobility. There is little doubt that students from low-income families face challenges few of their higher-income peers can fathom. There is also a remarkable amount of research that demonstrates the realistic possibility that low-income students can experience academic growth, social-emotional well-being, and academic achievement comparable to their wealthier peers.
In the days since OSSE published the STAR ratings and DC School Report Cards, a variety of opinions emerged relating to the validity of STAR as a measure of school quality. One prominent critique is that the STAR rating is essentially a measure of PARCC performance since a majority of the score is devoted PARCC growth and achievement metrics. Another legitimate line of questioning focuses on the impact of demographic factors on the STAR rating and whether it equates to judging schools based on the makeup of their student population.
To help inform this dialogue, OSSE published a STAR white paper, as well as a more detailed analysis which examines the impact demographics and individual metrics have on the final STAR score. We highly encourage anyone concerned about these issues to review this resource for a more in-depth analysis on the correlations and statistical significance of these variables on STAR scores.
We at EmpowerK12 wanted to use robust data science techniques to further explain these issues. We start by providing additional background on the analysis. Then, we discuss the relationship of demographics with STAR scores at every school level. In a future blog post, we will explore how much PARCC performance really determines a school's STAR rating.
Background information on this analysis
There are two relevant things to note about OSSE’s report in relation to this analysis. The OSSE analysis is broken down by framework with separate models for each school level. As such, we followed in their footsteps and structured our analysis by STAR framework. This is a necessary measure due to the different metrics within each framework and the inconsistent relationships between demographic factors and school performance across school levels as confirmed by our analyses below.
OSSE relied on a singular mathematical model to examine demographic driver influence, Ordinary Least Squares (OLS) multivariate linear regression, which is very good at predicting linear relationships between variables. However, due to the non-normal distribution of student demographics in schools across the city as well as the non-normal distribution of performance on many of the metrics within STAR, we examined a larger number of algorithms, the majority being non-linear.
Choosing the best mathematical model to measure the impact of demographics in predicting a school’s STAR rating
To understand the predictive value of demographics on STAR scores, we utilized Big Squid’s Kraken, an automated machine learning platform, to run statistical algorithms and identify patterns between performance and demographics. Schools spanning multiple frameworks were included in all models for which they had a score for that framework. Among six different types of regression algorithms evaluated, including linear regression, we found that a Random Forest Regressor was the most applicable algorithm in this scenario. In short, random forest algorithms use an ensemble of regression trees to discern patterns in the data.
We evaluated model performance by using a combination of metrics, primarily the coefficient of determination (r-squared) and the root mean square error (RMSE). R-squared captures the overall model accuracy, while the RMSE represents the amount of error in the model. Higher r-squared values and lower RMSE indicate better model performance. Random Forest had the strongest performance across STAR frameworks among all models considered (always in the top two for r-squared and RMSE), while linear regression (utilized by OSSE and other education advocates) finished in the middle of the pack for fit. Other viable mathematical models we evaluated include a gradient-boosted (XGB) regressor, K-neighbors regressor, support vector regression, and Stochastic gradient descent (SGD) regressor.
Figures 1a–1c below display the model performance for each Random Forest algorithm by framework.

Figure 1a

Figure 1b

Figure 1c
Figure 2 below shows the final Random Forest regressor model and fit statistics utilized for deeper analysis of demographic impacts on each STAR framework.

Figure 2
For the elementary school framework (ES) we found a model accuracy score of 43%, a score of 36% in the middle school framework (MS), and 22% in the high school framework (HS). While these relatively low model scores are partially due to the small sample sizes and only one year of data, they also indicate demographics alone are not valid predictors of STAR scores. The model scores vary between frameworks due to the amount demographics vary in the amount of contribution to STAR scores. We find that student demographics likely contribute approximately 20%-45% of school STAR scores, depending on the school framework level.
These values may be lower than you have seen elsewhere and is due to a couple primary factors:
We are talking about the predictive power of those factors on the final score while others utilize the r-squared value (the percent of the variation in school ratings explained by demographics.) Ultimately, we believe District policymakers care about how much of the actual score at each school level is explained by demographics, not just the variation among school scores.
Those relying heavily on r-squared as the way to describe demographic effects on STAR are more susceptible to unexplained background factors that share correlation with the demographic of interest. For example, it is true that 58% of the variance in middle school STAR scores is explained by percent at-risk served. However, that variance might also be partially explained by other collinear factors that have a correlation with at-risk such as distribution of teacher quality. This is why we instead chose to use machine learning algorithms to determine the direct impact of demographics on STAR score.
One final reason to be concerned about results from linear regression modeling is that those models can generate impossible outcomes. For the high school framework, the ordinary least squares linear regression model has a negative y-intercept (STAR score,) and it is impossible for a school to receive a negative STAR score.
Okay, demographics may be contributing up to 45% of the STAR score, so which specific factors have the most influence on STAR scores in elementary school?
Taking a deeper dive, we wanted to understand the influence of each demographic variable on STAR scores. We used a Pearson correlation matrix to understand the inter-correlation of variables, and the previously described Random Forest algorithm to parse out which of these variables is most influential on the final STAR score.
The correlation matrix in Figure 3 displays the correlations between major demographic factors and STAR Ratings on the elementary school framework. All correlation matrices presented in this analysis show Pearson correlation coefficients between -1 and 1 with those values representing perfect negative and positive correlations.
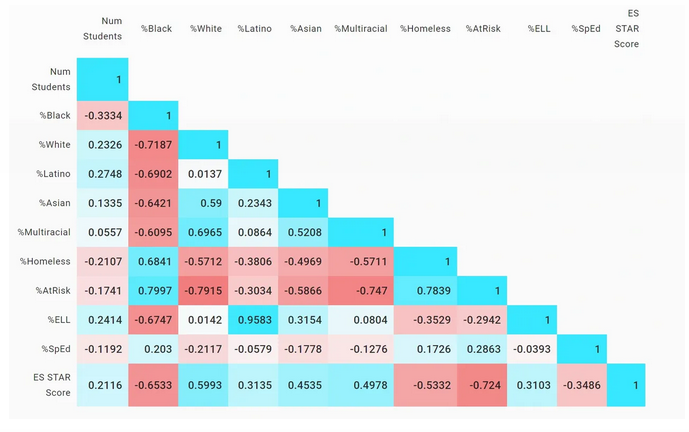
Figure 3
From this chart, we can see that %At-Risk, %Black, and %Homeless are the most highly correlated variables with STAR score, and each of these variables has a negative correlation with the score. The only other variable with a negative correlation is %SpEd.
To understand how these variables work together to influence STAR scores, we applied the Random Forest. Figure 4 displays the feature importance of demographic factors on STAR scores.

Figure 4
We can clearly see that %At-Risk has the greatest influence on STAR scores with other demographic factors fading into relative insignificance. With this information we conclude that within the elementary school framework %At-Risk is the demographic factor with the greatest effect on school performance. One likely reason racial demographics lose statistical significance after controlling for at-risk is the overlap, or collinearity in statistical terms, of race with socioeconomics in the District.
Middle school factors
Applying the same methodology to the MS framework, we find similar results to elementary but with one major difference.

Figure 5
The top three demographics from the ES framework all become less correlated with STAR scores at the middle school level. While the correlation coefficients slightly dropped for %At-Risk and %Homeless, %Black dropped by nearly 0.2. Conversely, %SPED increased by 0.2. We can see this change reflected in the driver importance chart below.

Figure 6
While %At-Risk is still tops the list, %SpEd jumps to the second most influential, more than doubling its feature importance compared to the ES framework. Additionally, %Homeless becomes more influential although it still has a comparatively low driver importance. Ultimately, %At-Risk is still the most important feature in predicting STAR scores, but %SpEd has a much greater impact in middle school than elementary.
High school factors
When looking at the high school correlations, we see significant changes in trends regarding the impact of multiple demographic factors.

Figure 7
% At-Risk and %Homeless have increased influence when compared to middle school and eclipse the initial correlations found for the elementary school framework. %SpEd correlation increases roughly the same amount between the MS and HS as in the ES and MS frameworks. Finally, %ELL drops by nearly 0.4, moving from a positive to a negative correlation with STAR scores at the high school level.
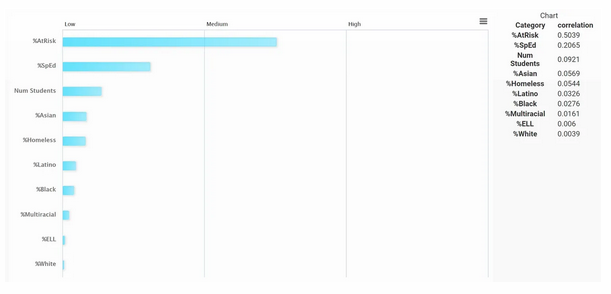
Figure 8
%At-Risk and %SpEd surface as the most important features, reflecting what was seen in the middle school in terms of their driver importance and the relative insignificance of other features.
All together now
After comparing the results of the analyses on each framework, we have three major takeaways:
%At-Risk is the most influential demographic factor across all three frameworks
The impact of %SpEd on STAR score varies greatly between frameworks. The correlation between %SpEd steadily increases from elementary-to-middle-to-high school with the HS correlation being more than double the ES correlation. %SpEd surfaces as the second most important driver in the MS and HS frameworks and is the only variable that begins to approach the importance of %At-Risk
While demographics alone are not valid predictors of STAR scores, they certainly have an impact. However, we believe it virtually impossible to fully understand that impact with only one year of data. Next year, as we see changes in demographics served and in school ratings, we will have a better idea of demographics on final school scores.
If demographics do not fully explain STAR scores, are there other measurable data points on the report card that can help us understand what leads to different STAR scores? Answer: Yes
Taking into consideration that demographics alone are not driving performance, we began pulling in other DC School Report Card data points that may have a meaningful impact on school performance. We included various publicly available data points we hypothesized might play a role in STAR scores such as teacher experience levels, suspension rates, and within year student entry and exit rates for each school. We combined the school entry and exit rates into one metric thus capturing the overall within-year transiency of the student population in a single metric. The addition of these drivers to the ES framework model had minimal effect on our model accuracy with none of these factors surfacing as a major driver of student performance. However, a few data points did help improve the MS and HS models.
Non-demographic factors that improve the middle school model
In our MS model, teacher years of experience had no discernible impact on STAR score. However, suspension rate and student churn (defined as the summation of student entry and exits over the course of a school year) had the second and third highest correlations with STAR scores, while %At-Risk remained the highest.

Figure 9
As a result, the feature importance is altered compared to the demographics only model.

Figure 10
%At-Risk is still the most influential variable but is closely followed by suspension rate. While these two variables have a moderately positive correlation of 0.5, this alone does not account for the strong feature importance of suspension rate.
Improvements to the high school model
For the HS framework, the addition of non-demographic variables had a much larger influence on STAR outcomes than at the elementary and middle school levels.

Figure 11
The notable changes between the high school and middle school models are the 0.2 decrease for suspension rate and 0.2 increase for student churn; however, these small changes have a massive effect on our driver influence and model score. The model fit score increased from 22% with just demographics to 55% with the inclusion of additional drivers and, for the first time, we found a variable with a greater influence than %At-Risk, student churn.

Figure 12
Student churn jumps to the top as the most important driver with a feature importance nearly seven times that of %At-Risk. Again, the “student churn” variable is defined as the absolute value summation of the percent of students who enter or exit the school after the enrollment audit. The magnitude of this driver influence helped to double the high school model’s accuracy.
Conclusion and directions for future research
First, we urge policymakers and eduWonks to take an abundance of caution with immediately interpreting causal effects from any of our and others' analyses on the relationship between demographics and STAR. Before any definitive statements can be made about the insights uncovered here, we need more years of data and more analyses utilizing student-level data to further explore these issues.
Therefore, we strongly encourage the new DC research consortium to prioritize research on the impact of student demographics and student transiency on school accountability ratings. The consistently high correlations and feature importance of %SpEd and %At-Risk are indicative of systematic problems facing these student populations. Schools serving higher percentages of these populations are receiving some additional financial resources to better educate them, but the Council has yet to fully fund our schools at the level their own adequacy study suggested they be funded nearly five years ago.