
More Instructional Time Matters
The pandemic’s disparate impact on student academic and social-emotional well-being has been extensively examined at the national and local levels (in DC, academic and well-being). DC Public Schools and public charter schools have spent significant energy working with their communities on initial COVID response (food and technology) and return to school plans as well as financial resources on updating school facilities to meet HVAC and social distancing requirements.
At the most recent Council learning loss public roundtable, the Deputy Mayor for Education presented updates on schools’ pandemic responses, plans for summer recovery activities, and the prospects for additional community engagement as reimagination plans start to take shape for the 2021-22 school year. One very important research resource we know many school leaders are using to help hone their strategic options is EdResearch for Recovery from Results For America and the Annenberg Institute at Brown University. In fact, OSSE and leaders from the EdResearch for Recovery initiative have met with LEA leaders multiple times this school year to provide relevant research updates as schools shift their response.
Among the broad-based academic support recommendations in the research is maximizing the amount of instructional time. Just how important is “maximizing instruction time” when it comes to academic outcomes, and what are ways to obtain more time? We analyze both in this blog post.
Instructional Time is Key to School and Student Level Outcomes
The American Institutes for Research published a meta-analysis report in 2014 that reviewed rigorous research studies on increased learning time. These are the quoted key findings from the study of studies:
Increased learning time programs improved literacy and math achievement when instruction was led by certified teachers, though the effects were small;
Effects varied by type of instruction. Programs that used a traditional instruction style improved literacy and math achievement. Programs that used an experiential learning instruction style improved student social-emotional skills. In both cases the effects were small; and
Increased learning time improved the literacy achievement of students performing below standards and the social-emotional skills of students with attention deficit/hyperactivity disorder.
Essentially, studies found better gains from increased instructional time for students who were at risk of academic failure and when that time was facilitated by certified teachers. There is evidence that high-dosage tutoring can be effective as well, but the chances of broader success increase when the additional instruction comes from the regular classroom teacher. Also, studies suggest that when extra time focuses on experiential learning there were positive outcomes on student social-emotional development.
Instructional Time Received is a Bigger Driver of School Outcomes than Demographics
It is well-known that socioeconomic demographics served are highly correlated with key schoolwide outcomes, both nationally and locally. In the District, percent at-risk served is correlated with STAR score and PARCC achievement at the school level, and yet, there are many schools demonstrating academic achievement beyond expectations.
Correlation and causation are certainly two different things. Often when we notice a strong correlation between two events, there is an underlying root cause linked to both events, creating the appearance of causality when there may be little to no real connection. For example, the strong correlation between ice cream and sunglass sales has an underlying root cause related to the season and amount of sunlight. The more sunlight per day, the warmer the weather tends to be, leading to an interest in cooling off by eating ice cream, and, likewise, the more the sun is out the more likely people will want sunglasses to protect their eyes.
We probed the causality between students designated as at-risk and school STAR scores by using advanced machine-learning algorithms and all the publicly-available report card data about schools. Our goal was to find which school inputs (types of students enrolled, programs offered, teacher data, etc.) are the primary drivers of school outcomes. Machine-learning tools are utilized by data scientists across many fields to improve predictive analytics, and usually there are many mathematical models that produce very good but not perfect results when trying to predict outcomes. Data scientists often combine multiple models into an ensemble forecast to provide a more consistently accurate forecast than a single model. For example, the National Weather Service utilizes an ensemble when it publishes weather forecasts daily.
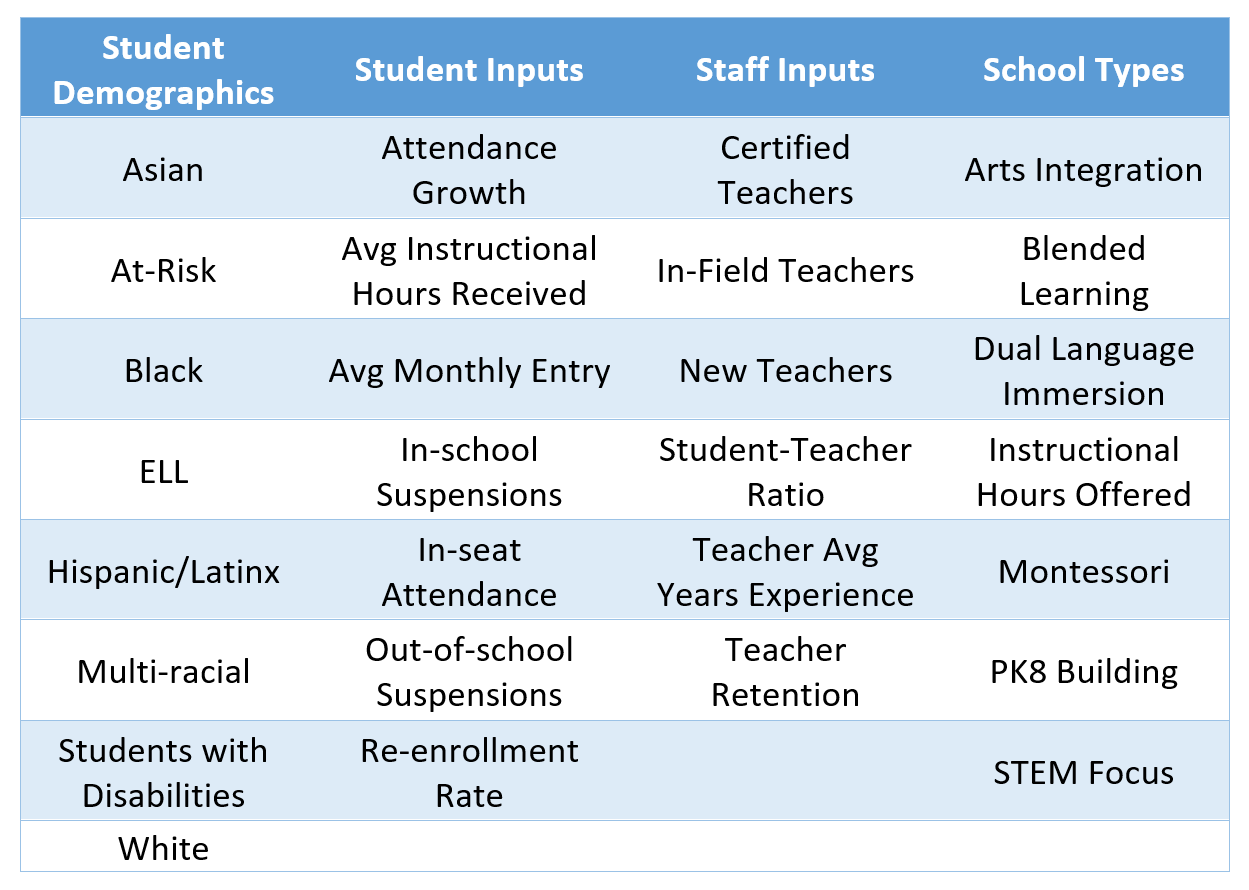
For this analysis, we created an ensemble machine-learning model to predict middle school student group STAR scores from 2017-18 and 2018-19 using the following student, staff, and school level information. For “instructional hours received,” we used operational hours from the DC School Report Card and school calendars available from DCPS and PCSB websites to compute the total number of “instructional hours” offered multiplied by the schoolwide attendance rate.
Why focus on middle school? Most importantly, the middle school framework scores include math and ELA growth for all grade levels included. High school has no growth, and elementary school only includes growth for 4th and 5th grade. Secondly, middle school is where we see some of the PARCC achievement and growth level off or decline citywide.

Collectively, the student, staff, and school inputs explain nearly three-fourths of the variation (r2 = 0.74) in middle school STAR student group scores using the ensemble model. The table shows which inputs had the most weight in predicting STAR scores. Notice that inputs related to attendance and instructional hours help explain differences in STAR scores more than the demographic makeup of the students who attend the school, including the percent at-risk served. (The STAR Score Weight’s sign indicates relationship directionality with a positive weight meaning an input increase is associated with an increase in STAR score.)
The weight values by themselves are difficult to interpret, so we used a model simulator produced by the machine-learning algorithm to better understand how input changes can impact predicted STAR scores. For reference, the average middle school student group score is 52.3 out of 100. We explain the impact by talking about a one standard deviation increase for inputs and translating them to practical terms.
For example, a one standard deviation increase in attendance growth (1.6, which is equivalent to students, on average, attending 2.5 more days of school in a 180 school day year compared to similar students) improve the STAR score by 6.1 points. A one standard deviation increase in instructional hours attended (140, or about an additional 45 minutes of school per day in a 180 day school year) improves the STAR score by 1.8 points. A one standard deviation increase in teacher retention rate (14%), improves the STAR score by 1.7 points. Finally, a one standard deviation increase in re-enrollment rate (9.5%) improves the STAR score by 1.7 points. One important limitation in interpreting these results is how inputs often interact with each other and the extent to which interventions and initiatives can change each of these variables. Why does attendance growth have a disproportionately larger impact than adding time to the school day? We posit that the hard relationship-building and joy of learning work that leads to better attendance rates adds value to learning throughout the day more so than simple adding an hour to the average school’s day.
Attendance is a Bigger Driver of Student Level Achievement than Demographics

We also utilized student-level pre-pandemic MAP and i-Ready data along with demographic and attendance information to understand how both contribute to students’ spring test scores. Employing a similar machine-learning ensemble model technique, we find the attributes below to be the biggest drivers of spring test scores. Unsurprisingly, the biggest predictors of spring scores are winter and fall test scores. After that, attendance plays a much larger role in student achievement than demographics and larger than LEA, school, and grade level fixed effects.
Teachers believe more time is needed to provide a well-rounded education
The DC State Board of Education recently released results from a survey this winter of over 1,000 teachers from 185 schools. The polling firm, Resonant Education, asked teachers how many more minutes should be spent on topics like science, social studies, the arts, and social-emotional skills even if it meant taking away from math and reading time. The average total additional time teachers recommended be spent on those topics totaled about two hours. We think it is likely schools can find efficiencies in the daily learning schedule, identify ways to creatively infuse math and reading skills into lessons for the other well-rounded topics, and add breaks throughout the day without adding a full two hours to the student schedule. KIPP DC Promise Academy’s principal, Monique Hardin-Simmons, provided testimony at the DC Council’s learning loss roundtable, discussing the unique ways they arrange the daily schedule to utilize data from morning exit tickets to determine afternoon reinforcement activities without spending more time on math and reading.
Teachers should be paid for the additional time in the school day or year. While many think DC teachers are among the highest paid in the country, our teacher salary-to-rent ratio is well below the national average. USA Today published data showing that the average starting teacher would spend 61% of their salary on the median rent/mortgage in DC, a higher proportion than most major cities in the US.
Ideas for Increasing the Amount of Instructional Time Received
The factors leading to improved attendance and increased instructional time received range from school scheduling to quality of family and student relationships to other academic and social-emotional well-being factors.
Invest in relationships, both student-to-student and student/teacher/family. Research suggests that students are more likely to attend school when there are strong relationships between students, their peers, and the school. Regular citywide student, teacher, and family surveys can help schools track progress and continually improve strategies in this area. Schools have different missions and serve different populations, so we recommend the development and reporting of response to a set of fundamental questions common across all LEAs.
Extend the school year. In the long-term, the most impactful systemic intervention that increases the amount of instructional time received while also cutting down the summer learning loss gap would be to add 2-3 weeks to the school calendar, adding in a couple extra breaks during the year as well. For 2021-22, that might mean starting a week earlier with a focus on social-emotional and joy of learning activities and adding an additional week or two in June with an additional early fall and late spring break.
Extend the school day. Adding at least one hour to the school day allows for additional schedule flexibility to embed high-dosage tutoring during the school day (a research-based best practice for tutoring), provide additional teacher planning and family engagement time within the school day, offer more extracurricular and experiential learning activities, and offer the well-rounded and social-emotional instruction opportunities. Longer days can also allow schools to provide students with more breaks throughout the day (which happens to be one of the top student response from our winter well-being survey question, “What do you like about learning from home this year that should be kept for next year?”).
Get creative. There are additional ways to add instructional time and increase attendance beyond those three items. Given the likelihood that schooling will include a device moving forward, let us try a few unique ways to maximize their usage for good in and out of school buildings. Students who need to stay home but can otherwise join school remotely should have the ability to do so. For now, that can include activities like those assigned during distance learning this year. In the future, live streaming should be available from every classroom. Other creative ways to extend learning time could come from our network of strong out-of-school time providers.