

How Much Do Demographic Shifts Account for DC PARCC Gains?
Over the last two decades, the District's demographic makeup has shifted in small and large ways, becoming more affluent with black/African American residents comprising a smaller share of the total population. Given the correlation between achievement and affluence, how much of the District's overall proficiency gains might be attributable to population changes and how much to overall student improvement?
For the purposes of this blog post, we will concentrate on demographic shifts beginning in 2015-16 because it was the first academic year with verified "at-risk" student data as well as the 2nd year of PARCC when all schools switched to computer-based testing (some took the PARCC on paper the first year as part of the transition from DC CAS). We examine three ways to approach answering this question in the detailed sections below.
Based on those analyses, we estimate that demographic changes explain somewhere between 9%-20% of the total proficiency rate gains since 2015-16, leaving between 80%-91% of the ELA/math combined PARCC achievement rate gains of +8.1 percentage points attributable to other factors. Taking the most conservative estimate of overall student proficiency gains related to student improvement of +6.5 points since 2016, the District compares favorably to Montgomery County which is +2.4 in the same time period and Prince George's County which is down -0.5.
How have student demographics changed in DC since 2015-16?
The graphic below from the new EdScape data portal from the Deputy Mayor for Education's office shows changes in enrollment by race/ethnicity over time.

In the 3 years since 2015-16, the share of total PK3-12 student enrollment for whites and Hispanics increased from 26% to 29% and the percent of the population identified as "at risk" decreased from 49% to 45%. Also, the percent of students with disabilities increased (13.7% to 15.1%) as well as the percent of English language learners (9.4% to 11.8%).
Next, we examine three different ways of estimating the impact of demographic changes on statewide proficiency rates utilizing publicly-available data. As is normal for these sorts of analyses, the estimates could be improved by using robust student-level data not available to us or the public.
Method 1: Re-weight 2016 PARCC results based on the 2019 student race population distribution
One way to control for changes in race is to take the proficiency rates for each race in 2016 and calculate an adjusted weighted proficiency based on the 2019 tested population counts. The chart below shows the total number of ELA and math tests by race and gender for 2016 and 2019 as well as their proficiency rate in 2016.

If we apply the updated 2019 population distribution to 2016 proficiency data, the overall statewide proficiency rate in 2016 would increase +0.7 percentage points, compared to the actual increase of +8.1 points over the same time period.
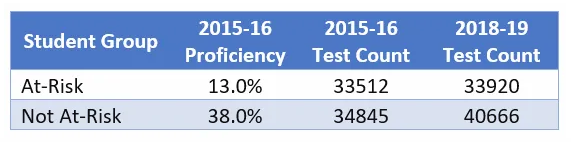
Method 2: Re-weight 2016 results based on 2019 socioeconomic distribution
While school proficiency rates are correlated with race served, they are more correlated with income status of their student body, derived from the percent at-risk served. Using the same methodology as race above, we find that the overall state proficiency rate in 2016 would improve +0.9 percentage points by 2019, accounting for 11% of the overall proficiency gains of +8.1 points.
Method 3: Utilize robust mathematical modeling to predict what the 2019 state proficiency rate should have been based on all demographics tested
Without going into too much detail, we utilized machine-learning algorithms from an industry leader, RapidMiner, to predict the state level proficiency rate for each year. We include all demographics in the predictive model (i.e. race, students with disabilities, at-risk status, ELL) and trained the model using outcomes at the school level from 2016-2019. The model suggested that changes in demographics at the state level should have lead to an improvement in overall proficiency of +1.7 percentage points. Again, DC actually improved +8.1, leaving an additional +6.4 point gain not attributable to demographic changes according to this method.
Update: a previous version of this post stated that 80-91% of achievement gains were attributable to "student improvement." While it is likely that student improvement is the primary source of gains, a student level cohort data analysis not available through public sources is needed to confirm it.