

Did STAR Ratings Impact DC Lottery School Choices This Year?
This past December, OSSE released the new common DC School Report Card with STAR scores and ratings for every school and subgroup within the school. Then, in February, parents finalized their school preferences for the SY2019-20 school year. We analyzed the newly released MySchoolDC waitlist data for next year, comparing it to historical data as well as other school factors included on the new report card, to find out whether the new rating system impacted school choice on a broad level.
Jumping into it, publicly-available data suggests the new ratings, at least for this year, had limited influence on family decisions. To successfully determine the extent of STAR's impact, we utilized all available data from the new school report cards as well as information about schools from MySchoolDC to understand what factors account for school choice. The table below includes all the elements about schools we analyzed in our machine learning algorithms for impact on waitlist length. We based the list on prior research from Mathematica and Education Forward DC/Wakefield about DC parent school choice. Jump down to the technical discussion section to learn more about the algorithms we examined.

School elements we analyzed for effect on school choice as measured by waitlist length.
We analyzed the impact of all elements above on both SY2019-20 waitlist length post-lottery as well change in length from prior years. Utilizing robust statistical methods and controls, the variables above account for 59% of the variation in school waitlist length, a statistically significant and sizable amount. For change in lengths this year, the elements above account for only 24% of the variation. This means that while we have a good idea of the factors impacting school choice overall, there is little predictive value in those same elements in determining change in waitlist lengths year-over-year.
What factors impact school choice from the data?
The chart below shows the percent of the total variation in SY2019-20 school waitlist length explained by different characteristics of the schools. The higher the percent the more that information impacts school choice.

Consistent with findings from the other DC studies about the factors influencing parent decisions, school choices are highly correlated with types of students who already attend the school. Student demographics, including socioeconomic status, race, and disability status, of their potential peers are the primary drivers of school choice. The 2016 Mathematica study on the DC lottery found that "parents generally place greater value on schools with a high percentage of students of the same race/ethnicity as their child—but only if their child would otherwise be in the smallest minority at school. If their child won’t be in the smallest minority, parents are less concerned about—and, in fact, supportive of—schools with a more diverse student body."

This graph shows how socioeconomic demographics of the student population factors in waitlist length more than school quality as measured by the STAR framework.
After controlling for demographic factors, parents appear to utilize information about achievement rates and the school’s location, including whether it is Metro-accessible and in a safer neighborhood, as influencers. The next most predictive factor is the school’s re-enrollment rate. We interpret this finding as the influence of word-of-mouth and parental satisfaction of those with students already at the school. Deeper research into individual family-level choices is needed to confirm that interpretation.
Finally, a school’s overall STAR score is a small but statistically significant factor in waitlist length. It explains just 1.2% of the total variation, compared to the combined total of 37% for school population demographics. The individual STAR rating (one-to-five star scale) for a school did not influence waitlist length in the first year. This may mean parents are utilizing the overall score more than the rating itself as a guide; additional family-level research is needed to confirm this potential finding.
But the STAR ratings are new, so do they explain changes to school waitlist lengths for the upcoming school year?
Given that the STAR rating system was released for the first time in December, we examined the influence in changes to waitlist length for the upcoming school year, looking at overall scores, subgroup scores, and individual overall rating.

To start, there is not much in the publicly-available data that explains year-over-year variation in waitlist lengths. It is likely that changes are mostly due to random, intangible factors based on families new to the District, where they live, and what their personal preferences happen to be. The introduction of STAR overall scores accounts for 1.4% of the change in waitlist size, while the individual rating itself did not have a statistically significant impact on changes. Student demographics and achievement were the largest measurable drivers of waitlist change, though their effect size was minimal.
Did 4 or 5-star schools serving a higher percentage of low-income students see increases in popularity?
Looking at historical waitlist data since the first Common Lottery for school year 2014-15, schools serving higher than average at-risk populations (greater than 51%) that performed well on STAR in 2018 have typically had longer waitlists than lower performing schools in the past, including both DCPS and public charter schools.

We checked to see if there was any differentiated impact between DCPS and the public charter sectors. The graph below breaks out high at-risk schools by sector.
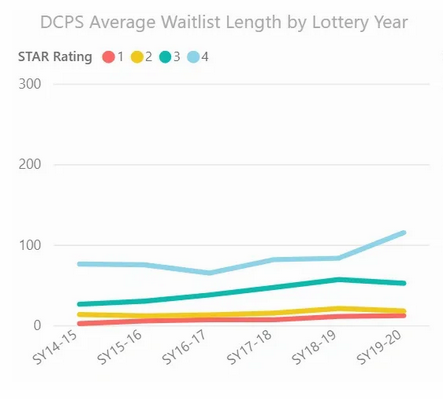

While it does appear as though the two 4-star DCPS schools saw a slight uptick in popularity and five 4-star public charter schools a slight decrease in popularity, neither change was statistically significant, meaning the changes are more likely due to random chance. In fact, none of the waitlist changes by STAR rating were statistically significant. We will continue to monitor this data in the coming years.
Which school programmatic offerings have a statistically significant impact on family choices?
As described above, a school’s student demographics, achievement levels, and location are the biggest drivers of school choice as measured by waitlist length. Of the programmatic options that schools offer and are listed on MySchoolDC, the following services are the only ones to have a statistically significant and positive correlation with waitlist length:
Offers after care
Offers before care
Dual language/immersion
Extended day
Extended year
Schools offering those services were more likely to have longer waitlists than similar schools (both demographically and location-wise) than schools that do not offer them.
What impact, if any, does this data have on policy and practice at the school and city levels right now?
At this time, with only one year of STAR results and subsequent lottery data, the data suggests that city officials continue to monitor future lottery results for impact. Perhaps the research-practice partnership should coordinate a refresh of the Mathematica study in a year or two.
The information we can actually suggest that school officials genuinely consider are the data related to the programmatic offerings at schools. Parents appear to prefer schools that offer before and after care for their children as well as those schools that offer additional instructional time for students. Perhaps an increase to the at-risk funding formula will help all schools have the opportunity to offer before and after care. There also appears to be a demand for language immersion programs. We know both DCPS and the public charter school sectors have increased the number of seats available in these programs, yet there remains a demand unfulfilled.
Additional technical discussion about the analysis
We utilized multi-model machine learning algorithms to help determine the factors driving school choice based on publicly available school-level data. The models examined for best fit included hierarchical linear models, random forest regressors, and nearest neighbors regressors. The mathematical model with the best fit statistics and lowest root mean square error was consistently the XGB Regressor no matter how we sliced the data.
Each of these models utilizes step-wise regression techniques to identify the variable with the greatest influence on waitlist length, controlling for it, and then identifying whether any other variables still have a significant impact. This iterative process helps distinguish any collinearity among the variables and isolate the factors truly influencing school choice.