
2023 DC PARCC Results: A Step Forward, But How Big and Equitable?
The 2023 District of Columbia state student assessment results in math and English Language Arts (ELA) are out, and they bring both cause for celebration and pause for reflection. While progress has been made since pandemic lows, we still have ground to cover before our students demonstrate achievement at levels similar to the pre-pandemic high of 2019. We focus this blog post on the PARCC test results, a rigorous assessment with items that require students to defend their answers and prove their knowledge on more than just simple multiple-choice questions. A select group of significantly cognitively disabled students complete a portfolio-based alternate assessment, called the MSAA. Data below examines proficiency on the PARCC that 99% of students in tested grade levels participate in.
The Good News: Gains in Math and ELA Proficiency
First, let’s start from a positive, asset-based frame of mind: the percentage of all DC students meeting or exceeding expectations in math and English, denoted by the PARCC 4+ metric, increased across the board. In ELA, the uptick was by 3.0 points, and in math, it was 2.5 points. Additionally, the PARCC 3+ metric, which measures students who are approaching, meeting, or exceeding expectations, rose by 2.1 points in ELA and a noteworthy 3.2 points in math, the highest single year gain in math 3+ proficiency since the test was first administered in 2015. Most every student group, including students designated as at-risk, students with disabilities, and English learners demonstrated gains in achievement since last year.
ELA PARCC 4+

Math PARCC 4+

These numbers are a testament to the resilience and hard work of students, educators, and parents/caregivers who have endured unprecedented challenges in and out of the classroom. The increments, albeit small, indicate that our educational system is moving in the right direction after the devastating effects of the pandemic.
The Longer Road to Pre-Pandemic Proficiency Levels
However, the PARCC data narrative is not all rosy (or should we say cherry blossom-y?). The uptick in scores is promising, but when we dig deeper into the data, we find that it will take another 3 years at the current average rate of improvement for ELA proficiency to return to 2019 pre-pandemic levels. Math fares even worse, requiring 4 more years to achieve the same feat. A couple of student groups are not currently on-pace for a return to pre-pandemic achievement rates.
Recovery Years Left at Current Rate of Improvement by Student Group and Metric

NOP = Not On-Pace for recovery, scores for the student group and metric declined in 2023 instead of recovering
The time lag for reaching pre-pandemic levels suggests that the pandemic's educational setbacks were significant and long-lasting. While gains this year are encouraging, it also reveals the depth of the academic hole our students and schools are dealing with. Federal COVID recovery funds expire in September of next year, and we must quickly learn which strategies are effective that we should double down on in the coming years. There is much work to do, and it will require strategic collaboration, innovative thinking, and a strong data mindset to accelerate learning and make up lost ground.
Widening and Narrowing Gaps: A (Mostly Positive) Paradox
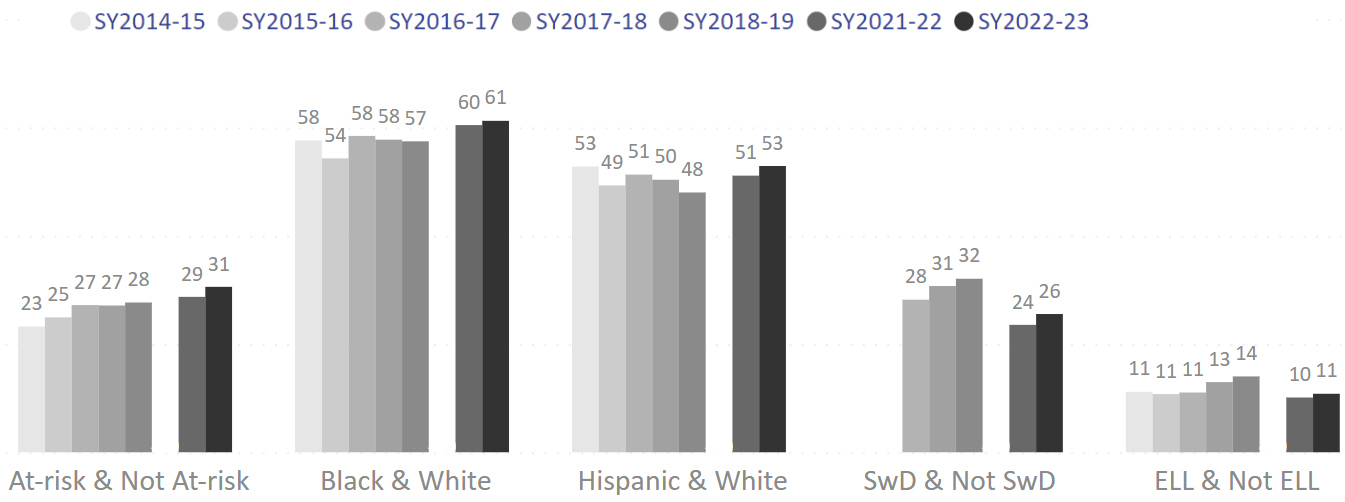
Arguably, the most intriguing—and concerning—aspect of the 2023 assessment results is what they reveal about equity in the system and proficiency gaps. The gap between socioeconomic groups and between minority students and their White peers at the state level widened for the PARCC 4+ metric but narrowed for the PARCC 3+ metric.
The widening gap for the PARCC 4+ metric indicates that while overall proficiency rates are rising, the benefits may not be evenly distributed across all levels of student performance. Higher performing students from affluent backgrounds and White students demonstrated greater gains in proficiency rates than their higher performing economically disadvantaged or minority peers.
PARCC 4+ Performance Gaps by Year
In contrast, the narrowing gaps for the PARCC 3+ metric suggest that equity-focused initiatives aimed at bringing struggling students up to an “approaching expectations” level are having some success. These programs, such as high-impact tutoring and out-of-school time enrichment activities, are essential because they help ensure that every student has at least a fundamental grasp of the subject matter.
PARCC 3+ Performance Gaps by Year

We still see a strong correlation between PARCC achievement and percentage of the school’s population who are students designated as at-risk. However, the proportion of a school’s proficiency rate, both PARCC 4+ and PARCC 3+, that can be mathematically explained by their students’ socioeconomic status (r-squared, coefficient of determination) decreased by 8% from last year. This is a positive takeaway and can be a sign that system-level initiatives aligned to achieving equitable outcomes (e.g. the at-risk weights in the funding formula) for our students are working. EK12 will continue to monitor progress in this area and dig deeper into the data in a Bold Performance Schools report in October.
PARCC At-Risk Plots and Coefficients of Determination (r-square) by Year and Proficiency Metric

Note about Bold Performance School Calculations
Speaking of Bold Performance Schools, at last year’s awards reception, we told school leaders that we temporarily lowered the Bold Performance bar to 5 percentage points above pre-pandemic expectations for schools serving similar grades and similar demographics. At this level, more than one standard error in our measurement, we felt comfortable in saying the schools we honored in 2022 had post-COVID achievement that was better than pre-COVID rates. We mentioned our plans to hold the model steady, utilizing pre-pandemic data to project what proficiency rate a school should expect given its tested population demographics, and that we would raise the bar to 7.5 percentage points above pre-pandemic expectations (PPAPPE, pronounced “papi”) in 2023 and to the original Bold Performance standard of 10 points above expectations in 2024. Then, in 2025, we will shift the Bold Performance model to utilize only post-pandemic test score data (2022-24).
Over the next few weeks, we will run and verify model data to identify this year’s Bold Performance schools and interview their educators to learn more about their promising recovery practices. We utilize a complex mathematical model that is a composite of multiple algorithms to calculate and average the PPAPPE results for math and ELA at both the PARCC 4+ and PARCC 3+ proficiency levels. Schools that achieve above a 7.5 PPAPPE score this year will be honored as a Bold Performance school, and given that we raised the bar, we will note as “honorable mention” other schools above the 5.0 mark that indicates the school’s students are beating pre-pandemic expectations for achievement based on the student population they serve, an accomplishment that also deserves recognition.
Conclusion
The 2023 DC PARCC results are mixed, but mostly positive. On one hand, they show that the educational system is resilient and capable of recovery, and on the other, results highlight inequalities and the long road ahead to return to pre-pandemic achievement levels. As we celebrate the gains, let's also use this as a moment to collaboratively identify strategies our system should double down on to close gaps and accelerate from incremental progress to bolder levels of growth for all students, and especially for students from historically marginalized groups.
DC’s Bold Performance schools demonstrate what it takes to accomplish a more equitable future. Their key practices, a focus of our 2022 Bold Performance Report, include an intentional effort to make school fun again for everyone by utilizing these strategies:
Intentional relationship-building among students, educators, and families to create an effective team that meets high expectations;
Emphasize the importance of fun and joyful environments for adults and students;
Extended learning time opportunities for students;
Targeted small-group and individual student interventions that allow students to access rigorous, grade-level content, even when they have unfinished learning gaps;
Teacher observation, collaboration, coaching feedback cycles and professional development that provide educators with support to improve; and
Weekly data and student-work analysis, progress-monitoring, and goal-setting conversations with educators and students.
To all of our educators, thank you for digging deep and showing up for our students! Best wishes for a wonderful start to the 2023-24 school year, and we look forward to reporting on more positive progress this time next year!
Explore more details about the DC state assessment results with our user-friendly dashboard.