

Are Achievement Gaps Widening in DC?
You may have heard conflicting information of late about whether student achievement gaps in the District of Columbia are widening or narrowing . As with most conversations about school data, there is nuance to addressing the question, and the answers rarely come with complete certainty. Below, we take a comprehensive look at many data points to try and determine if DC schools are helping to narrow gaps for traditionally disadvantaged student groups.
If you are looking for the quickest answer possible without going on a somewhat expansive data journey with us, then here's the scoop: by most every gap closure metric, our city's educator corps and students have been closing achievement gaps the past several years, and by some measures for a longer historical period than that. Also, we observe that gentrification has impacted the size of the within-DC achievement gap similar to its impact on overall achievement improvement.
What achievements gaps are people even talking about when they say "gaps are growing" or "shrinking"?
The most commonly referred achievement gap is the one between low-income students and their higher income peers. However, "achievement gaps" can also refer to several historically lower performing student groups and their higher achieving peers, such as Black/White, Latinx/White, Students with Disabilities/Students without Disabilities, and English Learners/Non-English Learners.
To complicate things, individuals and groups commenting on DC achievement gaps could be talking about gaps between student groups residing within the District or between historically disadvantaged groups in DC and their more advantaged peers across the nation. Both frames of reference are important to monitor, and we look at both gap types below. Though, we tend to prefer diving deeper into the local vs. national angle because EmpowerK12 does not believe in pitting our families against each other, preferring to promote collaboration and replication of all practices that improve student growth. Our tax dollars support all of our students at public schools, and our goal is for all students to be competitive for the career pathways of their choice both nationally and globally. Yet, we must ensure our own tax dollars are equitably distributed to give all students an equivalent chance at success, so tracking within-DC gaps is also an important practice in analyzing the health of our system.
One additional source of confusion can be the assessment used to determine the achievement gap. In DC, our 4th and 8th grade students take NAEP, the Nation's Report Card, every two years, and annually students in grades 3 through 8 as well as once in high school complete the PARCC test, an assessment utilized by a consortium of states. We explore both.
Gap Analysis #1: Achievement gaps between DC student groups and their more advantaged national peers on NAEP
We start by exploring how achievement gaps have changed over time on the NAEP between DC students and the nation (e.g. DC low-income student achievement compared to "not low-income" students across the country). The tables below show different cuts of the data for math and reading: NAEP reports average scores for every student group as well as percent of students at or above basic and proficient. Green cells indicate the achievement gap has shrunk for the student group over the given time period, and red means the gap has grown.

From the chart, we note that the achievement gap between DC's lowest income students and national not low-income students has consistently decreased over the last 16 years. For example, the difference in the achievement gap for DC low-income and national not low-income reading proficiency between 2011 and 2019 shrank 3.3 percentage points (see first chart in the second row and then 5th row, 4th column). More than 97% of the 240 achievement gap calculations above show a positive closing of national achievement gaps by District students since 2003. The most prominent gap closure rates are for racial gaps and students with disabilities. However, students with disabilities and socioeconomic gaps remain the largest and higher than the national average.
It's a positive thing that our lowest income students are gaining on their more affluent peers, yet the gap remains sizable. Are there other jurisdictions closing the gap faster that we can learn from?
Yes, but just one, Mississippi. Of the 75 cities and states (we classify DC as a state!) that take NAEP, only 6 are on a consistent pace to close the national achievement gap between their low-income students and not low-income students nationwide. In the other 69 jurisdictions, the gap for low-income students has widened over the last decade.

Mississippi has received wide praise for the commitment to utilizing the cognitive science of reading in the classroom among other reforms. Many District teachers have already received similar training from organizations with expertise in brain science like Turnaround for Children. We should make sure all schools are able to take advantage of similar professional development.
The District can and should aim to be the first jurisdiction in the nation to close the national achievement gap for low-income students by the end of this new decade. Bold Performance and Bold Improvement schools honored annually by EmpowerK12 are already on pace to accomplish this feat in less than 5 years. A stronger commitment to full equitable funding, continuous improvement, and collaborative replication of best practices can get us there.

Gap Analysis #2: Achievement gaps within DC student groups on NAEP
Similar to the national achievement gap charts above, the data below shows how our local achievement gaps have changed over time with green indicating a gap closure and red representing a gap that widened during the corresponding time period.

With a quick glance at the chart, you likely see more red cells than in the previous set of DC-national achievement gap charts. One quick example from the data above: from the top left chart, we find that DC students with disabilities have closed the gap on their local non-disabled peers by 5 scale score points in the last 4 years. However, that gap is also 5 points larger than it was back in 2007.
On the positive side of things, 78 of the 90 within-DC achievement gap calculations since 2013 (87%) are moving in the right direction towards closure. It is also true that a few of the present day achievement gaps, including the important income gap, are larger today than the have been in the distant past. We get into some of the "why" on that in a section below.
Why have within-DC achievement gaps been closing the last 4-6 years and not before? That's a hard question to answer, but our many of educational leaders representing a variety of organizations opened real dialogue on equity around the same time. The first drafts of an "at-risk student" definition and funding weight circulated during the 2013-14 school year.
Are there any states showing consistency in closing achievement gaps within the state where we might be able to glean lessons on equitable best practices?
Unfortunately, not really. Only Illinois, Michigan, North Carolina, and Arizona have posted shrinking within-state income achievement gaps over the last 2, 6, and 16 years, and only Illinois has a gap statistically significantly smaller today (-5.8 points) than in 2003. A cursory search on the internet does not indicate any specific practices in Illinois to address equity beginning earlier this century.
The challenge in closing achievement gaps within-jurisdiction is not just limited to DC. Since 2017, just 10 of the NAEP tested cities or states saw within-jurisdiction income gaps close at all, DC being one of them. Sustaining equitable education policies and outcomes is a challenge all Americans should resolve to tackle.

This set of charts shows our achievement gaps as a nation and how they have changed over time:

Does DC gentrification impact our within-DC socioeconomic achievement gap?
As we mentioned above, our local income achievement gap has been shrinking over the last 4-6 years but is larger today than 15 years ago. We dug deeper into the NAEP data for students not eligible for free and reduced-price meals to see if there was an explanation, especially considering that the Black-White and Hispanic-White achievement gaps within the District have precipitously fallen over the last 16 years. Our analysis finds that gentrification is one of the primary drivers of the within-DC socioeconomic achievement gap.

The next chart below shows the percentage of students by race who fall in the "not low-income" student group, meaning they do not receive free or reduced-price meals, and the average scale score for not low-income students. Notice the trend in percentage that more affluent white students comprise and how it mirrors the change in score.

The trend line for scale scores doesn't exactly follow the same trend as the bars, and this is likely because higher income black and Latinx students also made gains over time. We also know our not low-income white students are atypical from the rest of the country.

DC has the second highest per capita educational attainment in the country, and the list above shows the top 10 average NAEP scores for not low-income white students with DC coming in second.
There are a couple of ways to demonstrate the impact that the influx of affluent, highly-educated white families had on the absolute width of the DC achievement gap. First, we can hold constant the racial makeup of the not low-income student group starting in 2003 and apply their actual score changes by year to calculate an adjusted weighted average gap. The chart below shows the reported achievement gap, and what it would be when you control for racial demographic changes.

The demographically-controlled achievement gap follows the same trend with a downward slope the last six years, but the 2019 gap would be 12.9 points lower than the current level without gentrification.
A second method of controlling for gentrification would be to look at differences in the income gap within each race. For DC, there is only one race with a large enough sample size for both low-income and not low-income student groups to observe, black students. The two data tables below show the width of the income gap and its change over time for just black students in DC as well as all students in DC, compared to other large cities and the nation.


We find similar trends in socioeconomic gaps shrinking over the last 4-6 years and hope it continues.
Gap Analysis #3: Quick look at PARCC achievement gaps
PARCC is a tougher assessment to analyze for longitudinal changes in performance gaps for two main reasons:
The assessment is only 5 years old, and it has only been exclusively administered via computer for the last 3.
OSSE only reports percent of students by proficiency level and not average scale scores. It is more challenging to determine the true extent of gaps this way, and here's an example of why: The cut score for Level 4 (Meeting Expectations/Proficient) is a 750. Imagine a scenario where one student group all earns scores in the 745-749 range, and the other group gets scores in the 751-755 range. In this scenario, the gap would appear to be 100% as all of group 1 is not proficient and all of group 2 earned a proficient score. When, in actuality, the gap is only a few points.
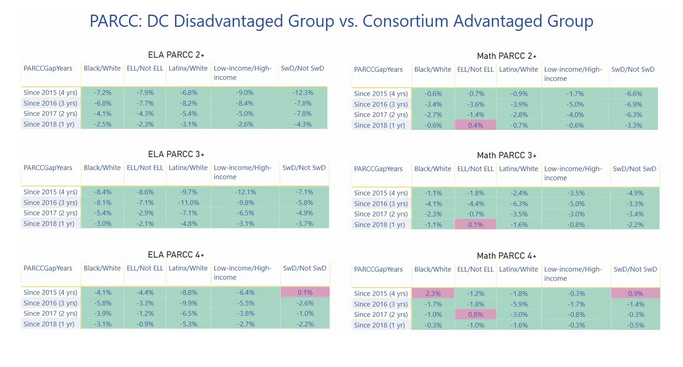
With access to student-level data, the forthcoming Research Practice Partnership (RPP) might be able to conduct a more robust study of PARCC gaps than we can with the publicly-available data. Anyway, below are two charts showing the gaps in proficiency rates within-DC and between DC students and their PARCC consortium peers. The gap closure trends are similar to NAEP with DC students gaining on their national peers, and mixed results locally.

So what accounts for the recent shift to shrinking achievement gaps within the District that makes DC somewhat unique among US jurisdictions?
This is a tough question to answer without access to student-level PARCC and NAEP data as well as student enrollment histories. We are hopeful that the RPP will have the opportunity to robustly analyze this data to try and resolve the question. There has been an increased emphasis on equity thanks to the leadership of several advocacy networks including OSSE staff and State Board of Education members as well as Education Committee Chair, Councilmember Grosso, and Council Chairman Mendelson. We hope this advocacy does not let up.
The at-risk funding weight in the UPSFF formula might have something to do with the shift as well. While it is clear there's work to be done to ensure at-risk dollars are well spent in some places, it is also the case that the Mayor and Council have not fully funded either the Adequacy base rate nor the full proposed at-risk weight. It is finally time to commit to a plan that does so.